지난 10년간 기후변화 영향력 급속도로 커져
2023년, 기록상 가장 더운 해로 기록…전 세계 빙하 연평균 1m씩 얇아져
지구 축적 열 90% 바다에 저장돼…지난 20년 동안 해양 온난화 급증
3대 온실가스(CO2·CH4·N2O) 대기농도 지속 증가…기온 상승 방지 위해 배출량 줄여야
(Rate and Impact of Climate Change Surges Dramatically in 2011〜2020)
세계기상기구(WMO)는 △2011〜2020년 기록적인 더위 기록 △전례 없는 빙하 및 빙상 녹음 △해수면 상승 가속화 △해수면 기온 및 산성화로 해양 생태계 파괴 △지속가능한 발전목표(SDGs)를 저해하는 극한 기후 △오존층 회복 궤도 진입 등의 주요 메시지(Key Messages)를 담은 ‘2011〜2020년 기후변화의 속도 및 영향 급증(Rate and Impact of Climate Change Surges Dramatically in 2011〜2020)’ 보고서를 지난 12월 5일 발표했다. 세계기상기구의 새로운 보고서에 따르면, 기록상 가장 따뜻한 10년이었던 2011년과 2020년 사이 기후변화의 속도는 놀랄 만큼 급증했으며, 지속적으로 증가하는 온실가스 농도는 육지와 바다의 기록적인 기온 상승에 영향을 끼쳤고 빙하를 녹여 해수면 상승이 가속화되고 있다. 이 보고서 내용을 요약했다.
[번역·정리 = 배민수 부장]
![세계기상기구(WMO)의 새로운 보고서에 따르면, 기후변화의 속도는 기록상 가장 따뜻한 10년이었던 2011년에서 2020년 사이에 놀랄 만큼 급증했는데, 계속 증가하는 온실가스의 농도는 육지와 바다 온도를 높여 얼음을 녹이고, 해수면 상승을 가속화시키는 것으로 나타났다. [사진출처 = 세계기상기구(WMO)]](https://cdn.waterjournal.co.kr/news/photo/202401/73004_45085_5311.jpg)
2011〜2020년 급격한 기온 상승으로 저지대 위협
2011〜2020년 세계기후는 가속화의 10년으로, 특히 극지방과 높은 산에서 일어나고 있는 심각한 변화에 경종을 울렸다. 빙하는 매년 약 1m씩 얇아져 수백만 명의 물공급에 장기적인 영향을 미쳤다. 남극 대륙의 빙하에서는 2011〜2020년 사이에 2001〜2010년보다 약 75% 더 많은 얼음이 녹았다. 이는 미래의 해수면 상승에 대한 불길한 징조로 해안 저지대와 국가의 존망을 위태롭게 하고 있다.
보고서에 따르면 한줄기의 희망(Glimmer of Hope)으로 2011〜2020년 기간 남극의 오존층 파괴가 심한 오존층 지역(Ozone Hole)이 지난 20년간보다 줄어든 것은 오존층을 파괴하는 화학물질을 단계적으로 제거하기 위한 일치된 국제적인 행동 덕분이며, 이는 몬트리올 의정서(Montreal Protocol)의 성공을 나타낸다.
페테리 탈라스(Petteri Taalas) 세계기상기구 사무총장은 “1990년대 이후 매 10년은 이전보다 따뜻했으며, 이러한 추세는 바로 바뀔 기미를 보이지 않고 있다. 더 많은 국가가 다른 어떤 10년보다 기록적인 높은 기온을 갱신했다고 보고했다. 지구의 바다는 점점 더 빨리 따뜻해지고 있고 해수면 상승 속도는 한 세대도 채 되지 않아 약 두 배에 도달했다. 우리는 빙하의 녹는 속도와 빙하를 지키기 위한 경쟁에서 지고 있다”고 말했다. 그는 이어 “이는 분명히 인간 활동에서 발생하는 온실가스 배출에 의해 주도되고 있다”면서 “우리는 기후변화가 통제 불능 상태로 치닫는 것을 막기 위해 가장 우선적으로 지구의 온실가스 배출을 줄여야만 한다”고 덧붙였다.
탈라스 사무총장은 “지구의 날씨는 사회경제 발전에 뚜렷한 영향을 미치면서 점점 극단화되고 있다. 가뭄, 폭염, 홍수, 열대성 저기압과 산불은 기반시설에 피해를 주고 농업 생산량을 감소시키며 물공급을 제한하고 질량 변위를 일으킨다”면서 “특히, 지난 10년간 극심한 더위의 위험이 크게 증가했다는 것은 여러 연구에서 보여주고 있다”고 말했다.
The Global Climate 2011〜2020 : A Decade of Acceleration sounded the alarm, in particular, at the profound transformation taking place in Polar regions and high mountains. Glaciers thinned by around 1 meter per year - an unprecedented loss - with long-term repercussions for water supplies for many millions of people. The Antarctic continental ice sheet lost nearly 75% more ice between 2011-2020 than it did in 2001-2010 - an ominous development for future sea level rise which will jeopardize the existence of low-lying coastal regions and states.
In a glimmer of hope, the report said that the Antarctic ozone hole was smaller in the 2011-2020 period than during the two previous decades thanks to successful and concerted international action to phase out ozone depleting chemicals, an indication of the success of the Montreal Protocol.
“Each decade since the 1990s has been warmer than the previous one and we see no immediate sign of this trend reversing. More countries reported record high temperatures than in any other decade. Our ocean is warming faster and faster and the rate of sea level rise has nearly doubled in less than a generation. We are losing the race to save our melting glaciers and ice sheets,” said WMO Secretary-General Prof. Petteri Taalas.
“This is unequivocally driven by greenhouse gas emissions from human activities,” said WMO Secretary-General Prof. Petteri Taalas. “We have to cut greenhouse gas emissions as a top and overriding priority for the planet in order to prevent climate change spiralling out of control,” he said.
“Our weather is becoming more extreme, with a clear and demonstrable impact on socio-economic development. Droughts, heatwaves, floods, tropical cyclones and wildfires damage infrastructure, destroy agricultural yields, limit water supplies and cause mass displacements,” said Prof. Taalas. “Numerous studies show that, in particular, the risk of intense heat has significantly increased in the past decade.”
기후목표 달성 위해 기후 관련 예산 대폭 확대 필요
보고서는 10년에 걸친 극한 현상이 특히 식량 안보, 이주(Displacement) 및 철새의 이동(Migration)에 엄청난 영향을 미쳐 국가 발전과 지속가능한 발전목표(SDGs)의 진전을 저해했는지에 대해 기록하고 있다. 그러나 이는 또한 예측·조기 경보 및 통합된 재난 관리·대응의 개선이 어떻게 차이를 만들어 내는지를 보여줬다. 경제적 손실이 증가했음에도 불구하고 조기 경보 시스템의 개선과 관련해 극한 상황으로 인한 사상자 수는 감소했다. 2011〜2020년에 공공 및 민간 기후 예산은 약 두 배 증가했다. 그러나 기후 목표를 달성하려면 2030년까지 최소한 7배가 증가해야 한다.
이 보고서는 ‘제28회 유엔기후변화협약 당사국총회(COP28)’에서 발표됐으며, 지구 온도 상승을 산업화 이전 시대보다 1.5℃ 이하로 제한하기 위해 훨씬 더 야심찬 기후행동이 필요하다고 강조했다. 10년 기후 현황 보고서는 기후의 연도별 변동성을 능가하고, 더 장기적인 관점을 제공한다. 또한 세계기상기구의 연례 지구 기후 보고서를 보완한다. COP28에서 발표된 2023년 잠정 연례 보고서는 2023년이 기록상 가장 따뜻한 해가 될 것이라고 밝혔다. 이 보고서는 물리적 데이터 분석과 국립기상수문학 서비스, 지역 기후 센터, 통계청 및 유엔 파트너 수십 명의 전문가들의 영향 평가를 기반으로 한다.
The report documents how extreme events across the decade had devastating impacts, particularly on food security, displacement and migration, hindering national development and progress toward the Sustainable Development Goals(SDGs). But it also showed how improvements in forecasts, early warnings and coordinated disaster management and response are making a difference. The number of casualties from extreme events has declined, associated with improved early warning systems, even though economic losses have increased. Public and private climate finance almost doubled between 2011 and 2020. However, it needs to increase at least seven times by the end of this decade to achieve climate objectives.
The report was released at the UN Climate Change Conference, COP28, and emphasizes the need for much more ambitious climate action to try to limit global temperature rise to no more than 1.5℃ above the pre-industrial era. The Decadal State of the Climate report provides a longer-term perspective and transcends year-to-year variability in our climate. It compliments WMO’s annual State of the Global Climate report. The provisional annual report for 2023, released at COP28, said that 2023 is set to be the warmest year on record. The report is based on physical data analyses and impact assessments from dozens of experts at National Meteorological and Hydrological Services, Regional Climate Centres, National Statistics Offices and United Nations partners.
2011〜2020년 육지·바다, 기록상 가장 따듯한 10년
2011〜2020년은 육지와 바다 모두에서 기록상 뚜렷하게 가장 따뜻한 10년인 것으로 나타났다.
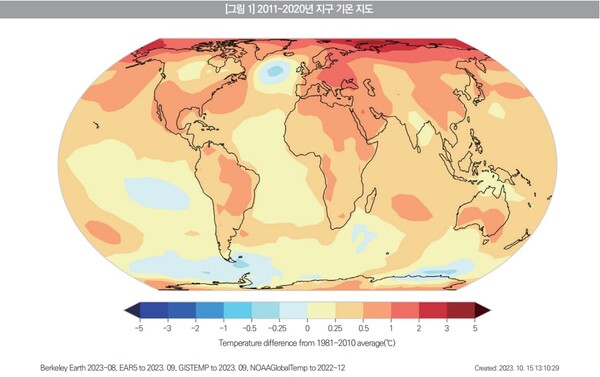
2011〜2020년 지구의 평균 기온은 1850〜1900년 평균 기온보다 1.10±0.12℃ 높았다. 이는 WMO가 사용한 6개 데이터 세트의 평균에 기반한 것으로, 전 세계적으로 가장 따뜻한 해는 2015년에서 2020년 사이였다.
1990년대 이후 매 10년 단위로 지난 수십 년보다 따뜻해졌다. 강력한 엘니뇨 현상으로 인해 10년 중 가장 따뜻한 해는 2016년과 2020년이었다. 1981〜2010년 평균보다 2℃ 이상 높은 곳 중 10년 동안 가장 많은 이상 현상이 북극에서 발생했다. 다른 어떤 10년보다 더 많은 국가에서 기록적인 높은 기온을 갱신했다고 보고했다.
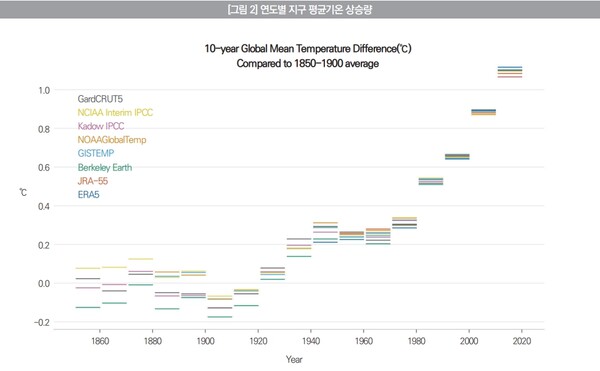
It was the warmest decade on record by a clear margin for both land and ocean. Global mean temperature for the period 2011〜2020 was 1.10 ± 0.12℃ above the 1850-1900 average. This is based on the average of six data sets used by WMO. The warmest six years on record globally were between 2015 and 2020. Each successive decade since the 1990s has been warmer than all previous decades. The warmest years of the decade were 2016, because of a strong El Niño event, and 2020. The largest positive anomalies for the decade, in places more than 2℃ above the 1981〜2010 average, were in the Arctic. More countries reported record high temperatures than in any other decade.
CO2·CH4·N2O 등 온실가스 대기농도, 10년간 지속적 증가
이산화탄소(CO2)·메탄(CH4)·아산화질소(N2O) 등 3대 온실가스의 대기 농도는 지난 10년간 지속적으로 증가했다. 산업화 시대가 시작되기 전까지 약 1만 년 동안 대기 중 이산화탄소는 280ppm으로 거의 일정하게 유지됐다. 이후 화석 연료의 연소, 삼림 벌채, 토지 이용의 변화 등이 주된 원인으로 작용해 2020년에는 이산화탄소가 약 1.5배 증가해 413.2ppm에 도달했다.
1991〜2000년 10년간 지구 평균 이산화탄소 농도는 361.7ppm이었고 2001〜2010년 10년 동안은 380.3ppm이었고 2011〜2020년에는 402.0ppm으로 증가했으며, 같은 기간 동안 각각 연평균 1.5ppm, 1.9ppm, 2.4ppm으로 증가했다. 기후를 안정시키고 추가적인 온난화를 방지하기 위해서는 지속 가능하게 배출량을 줄여야 한다.
![이산화탄소(CO2)·메탄(CH4)·아산화질소(N2O) 등 3대 온실가스의 대기 농도는 지난 10년간 지속적으로 증가했다. 화석 연료의 연소, 삼림 벌채, 토지 이용의 변화 등이 주된 원인으로 작용해 2020년에는 이산화탄소가 약 1.5배 증가해 413.2ppm에 도달했다. [사진출처 = 세계기상기구(WMO)]](https://cdn.waterjournal.co.kr/news/photo/202401/73004_45086_5338.jpg)
Atmospheric concentrations of the three major greenhouse gases continued to increase over the decade. For about 10,000 years before the start of the industrial era, atmospheric carbon dioxide remained almost constant at around 280 ppm(ppm=number of molecules of the gas per million molecules of dry air). Since then, CO2 has increased by nearly 50% reaching 413.2 ppm in 2020, primarily due to the combustion of fossil fuels, deforestation, and changes in land-use.
The decadal global average CO2 during 1991〜2000 was 361.7ppm, during the decade 2001-2010 it was 380.3 ppm, while in 2011〜2020 it rose to 402.0 ppm. During the same periods the average growth rate increased from 1.5 ppm/yr and 1.9 ppm/yr to 2.4 ppm/yr. In order to stabilize the climate and prevent further warming, emissions must be sustainably reduced.
해양, 해양 온난화 및 산성화 속도 증가
해양 온난화(Ocean Warming) 및 해양 산성화가 가속화되고 있다. 지구에 축적된 열의 약 90%는 바다에 저장된다. 특히 지난 20년 동안 해양 온난화는 무서운 속도로 증가했다. 2천m 수심 해양의 온난화 비율은 2006〜2020년 기간 동안 1.0±0.1 Wm-2(지구 장파 복사 측정 단위)에 달했는데, 이는 1971〜2020년 전체 기간 동안 0.6±0.1 Wm-2에 비해 2006〜2020년 기간 동안 1.0±0.1 Wm-2에 달했다. 이는 2020년에 사상 최고치를 기록했으며, 향후에도 이러한 추세가 지속될 것으로 예상된다. 바다에 이산화탄소가 축적되면 산성화, 즉 해양 pH의 저하로 해양 생물이 껍질과 골격을 형성하고 유지하는 것이 더 어려워진다.
Rates of ocean warming and acidification are increasing. Around 90% of the accumulated heat in the Earth system is stored in the ocean. Ocean warming rates show a particularly strong increase in the past two decades. Ocean warming rates for the upper 2000m depth reached rates of 1.0 ± 0.1 Wm-2 over the period 2006-2020, compared with 0.6 ± 0.1 Wm-2 over the full 1971〜2020 period. It reached a record high in 2020 and it is expected that this trend will continue in the future. A consequence of the accumulation of CO2 in the ocean is its acidification, namely a drop in the oceanic pH, which makes it more challenging for marine organisms to build and maintain their shells and skeletons.
해양열파, 빈도 잦아지고 강도 세져
해양열파(Marine Heatwaves)의 빈도와 강도가 점점 증가하고 있다. 2011〜2020년 바다의 해수면 약 60%에서 해양열파가 발생했다. 해양열파의 평균 일수가 가장 높은 연도는 2016년(61일), 2020년(58일), 2019년(54일) 순이다. 해양열파는 최근 10년 동안 상대적으로 더 극심해졌다. 해양열파는 카테고리 Ⅰ(보통, Moderate)보다 카테고리 Ⅱ(강한, Strong) 규모가 더 흔하게 발생했다. 지난 10년 동안 매년 평균 0.5일의 극한 해양열파(카테고리 Ⅳ)가 발생했고, 2016년에는 하루 종일 발생했다. 과거에는 전체 생태계를 변화시킬 수 있는 이러한 극한 현상이 거의 발생하지 않아 전 지구적인 규모로 측정하기가 어려웠다.
Marine heatwaves are becoming more frequent and intense. In any given year between 2011 and 2020, approximately 60% of the surface of the ocean experienced a heatwave. The three years having the highest average of days with marine heatwaves were 2016(61 days), 2020(58 days), and 2019(54 days). Marine heatwaves have become relatively more intense in the most recent decade. Category II(Strong) events have become more common than those rated in Category I(Moderate). There was an average of 0.5 day extreme marine heatwave(Category IV) per year in the past decade, with 1 full day in the El Niño year 2016. In the past these extreme events - which can change entire ecosystems - were so uncommon that they could hardly be measured on a global scale.
해양열파로 빙하 녹아 지구 해수면 상승 가속화
해양열파 현상으로 육지에서 빙하가 손실되면서 지구 평균 해수면 상승이 가속화되고 있다.
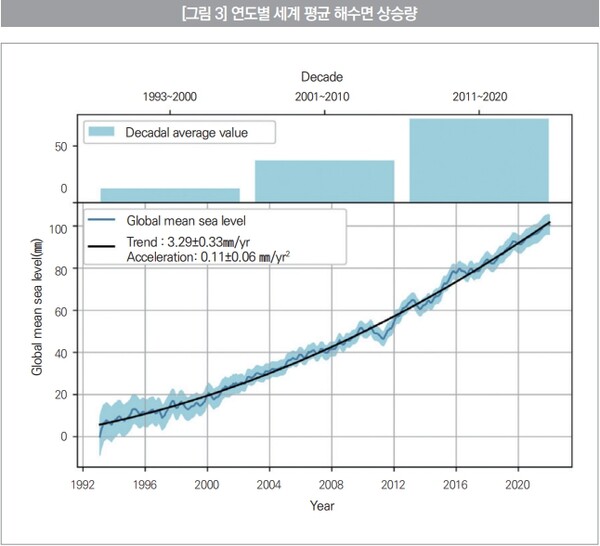
2011〜2020년 해수면은 연평균 4.5㎜ 상승했다. 이는 2001〜2010년의 2.9±0.5㎜와 비교된다. 지구 평균 해수면 상승은 가속화됐는데, 이는 대부분 그린란드(Greenland) 빙상의 빙하 질량 감소가 가속화됐기 때문이며, 이보다 정도는 덜하지만 빙하가 녹고 바다가 따뜻해지는 것이 가속화됐기 때문이다.
Global mean sea level rise is accelerating, largely because of ocean warming and the loss of land ice mass. From 2011 to 2020, sea level rose at an annual rate of 4.5mm/yr. This compares with 2.9±0.5mm/yr in 2001〜2010. Global mean sea level rise has accelerated, mostly due to a speeding up of ice mass loss from the Greenland ice sheet, and, to a lesser extent, due to accelerated glacial melting and ocean warming.
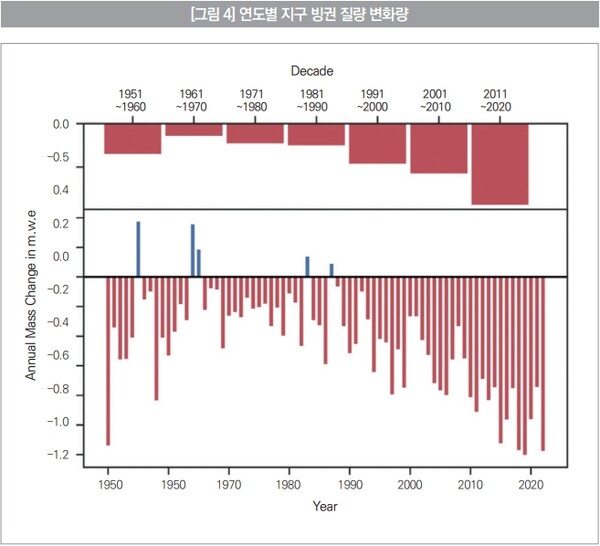
빙하, 현대 기록상 전례 없이 빠르게 녹아
빙하는 유례없는 속도로 빠르게 유실되고 있다. 2011〜2020년 전 세계에서 측정된 빙하는 연평균 약 1m씩 얇아졌다. 장기간 측정된 42개의 빙하 대조군을 기반으로 한 최근의 평가는 2011년에서 2020년 사이의 기간이 관측된 10년 단위 기록 중 가장 낮은 평균 물질균형(Mass Balances)을 보였다는 것을 보여준다. 빙하에 영양분을 공급하는 겨울눈이 여름 동안 완전히 녹으면서 물질균형 빙하 대조군 중 일부는 이미 녹았다.
2000년부터 2020년까지 거의 19개의 주요 빙하 지역 모두에서 점점 더 큰 음의 값(Negative Values)이 나타났다. 적도 부근에 남아 있는 빙하들은 대체로 빠르게 감소하고 있다. 인도네시아 파푸아(Papua)의 빙하는 향후 10년 안에 완전히 사라질 것으로 예측됐으며, 아프리카의 경우, 루웬조리(Rwenzori) 산맥과 케냐 산의 빙하는 2030년까지, 킬리만자로의 빙하는 2040년까지 사라질 것으로 예상된다.
Glacier loss is unprecedented in the modern record. Glaciers that were measured around the world thinned by approximately 1m per year on average between 2011 and 2020. The latest assessment based on 42 reference glaciers with long-term measurements reveals that the period between 2011 and 2020 saw the lowest mean mass balances of any observed decade. Some of the mass balance reference glaciers have already melted away, as the winter snow nourishing the glacier melts completely during the summer months.
Nearly all the 19 primary glacier regions have witnessed increasingly large negative values from 2000 to 2020. The remaining glaciers near the Equator are generally in rapid decline. Glaciers in Papua, Indonesia are likely to disappear altogether within the next decade. In Africa, glaciers on the Rwenzori Mountains and Mount Kenya are projected to disappear by 2030, and those on Kilimanjaro by 2040.
그린란드, 빙상 유실 지속적으로 증가
2011〜2020년 그린란드·남극에서는 2001〜2010년보다 38% 더 많은 빙하가 녹았다. 그린란드와 남극 대륙의 빙하는 2천950만㎦의 얼음 덩어리를 저장하고 있는 지구상에서 가장 큰 담수 저장소이다. 빙하에서 얼음 덩어리가 떨어져 나가면 지구 평균 해수면을 높이는 데 직접적으로 기여하므로 해수면 변화를 평가하는 데 얼음의 양을 관찰하는 것이 중요하다.
2011〜2020년 10년 동안, 그린란드는 매년 평균 251기가톤의 얼음이 녹았고, 2019년에는 기록적인 444기가톤의 얼음이 손실됐다. 남극 대륙 빙하는 이 10년(2011~2020년) 동안 연평균 143기가톤이 유실됐고, 이 얼음 덩어리 손실의 4분의 3 이상이 남극 서쪽에서 발생했다. 이전 10년(2001〜2010년)과 비교하면, 이는 빙하 유실이 약 75% 증가한 것이다. 이는 남극 해빙(海氷)과 같지 않다. 그린란드와 남극 빙상을 합한 경우 2001〜2010년에 비해 빙상 유실이 38% 증가했다. 그린란드와 남극 빙상 손실이 연간 84기가톤에 달했던 1990년대(1992〜2000년)에 비해 지속적으로 증가한 것으로 확인됐다.
Greenland and Antarctica lost 38% more ice between 2011 and 2020 than during the 2001-2010 period. The Greenland and Antarctic continental ice sheets are the largest freshwater reservoirs on Earth, storing a volume of 29.5 million ㎦ of frozen water. When ice sheets lose mass, they directly contribute to raising the global mean sea level and, therefore, monitoring the volume of ice they gain or lose is critical to assessing sea level change.
During the 2011-2020 decade, Greenland lost mass at an average rate of 251 Gigatonnes (Gt) per year and reached a new record mass loss of 444 Gt in 2019. The Antarctic continental ice sheet lost ice at an average rate of 143 Gt yr- during this decade, with more than three-quarters of this mass loss coming from West Antarctica. Compared to the previous decade (2001〜2010), this represents an increase of nearly 75% in ice losses. This is not the same as Antarctic sea ice. For the Greenland and Antarctic ice sheets combined, there was an increase of 38 % in ice losses compared to 2001-2010. It confirms the sustained increase in losses compared to the 1990s (1992-2000), when Greenland and Antarctica ice sheet losses amounted to 84 Gt yr.
북극 해빙, 지속적 감소 추세
북극의 해빙 범위는 수십 년 동안 지속적으로 감소하고 있는데, 계절적 평균 최저치는 평균보다 30% 낮았다. 북극 해빙은 특히 여름철 녹는 기간 동안 지속적으로 감소했다. 2011〜2020년 기간 동안의 계절적 평균 최소 범위는 437만㎢로 1981〜2010년 평균 622만㎢보다 30% 낮았다. 겨울철 축적 기간 동안 감소는 덜 두드러졌지만 여전히 상당했으며 10년 동안의 연평균 최대치는 1천478만㎢로 1981〜2010년 기간의 평균 1천565만㎢보다 6% 낮았다.
이 지표들에 대한 데이터는 더 제한적이지만, 해빙 면적의 감소는 두께와 부피의 감소를 동반했다. 또한 1년 이상 지속된 얼음 범위의 현저한 감소가 있었다. 1985년 3월 북극해 전체 얼음 덮개 중 오래된 얼음(4년 이상)이 33%를 차지했지만, 그 수치는 2010년까지 10% 아래로 떨어졌고, 2020년 3월에는 4.4%로 떨어졌다.
Arctic sea ice extent continues a multi-decade decline: the seasonal mean minimum was 30% below average. Arctic sea ice continued to decline, particularly during the summer melt season. The mean seasonal minimum extent during the 2011〜2020 period was 4.37 million ㎢, 30% below the 1981〜2010 average of 6.22 million ㎢. The decrease was less pronounced, but still substantial, during the winter accumulation season, with an annual mean maximum during the decade of 14.78 million ㎢, 6% below the 15.65 million ㎢ average for the 1981〜2010 period.
Reduced sea ice extent was accompanied by a decrease in thickness and volume, although data for these indicators are more limited. There has also been a marked decrease in the extent of ice which lasted for more than one year. In March 1985, old ice (four years or more) accounted for 33% of the total ice cover of the Arctic Ocean, but that figure had fallen below 10% by 2010, and in March 2020 it had dropped to 4.4%.
파괴된 오존층 회복 추세
2011〜2020년 오존층 파괴가 심한 오존층 지역은 지난 20년 동안보다 더욱 줄어들었다. 평균적으로 2011〜2020년 기간 동안 연간 최대 질량 부족(Mass Deficit)은 지난 20년 동안보다 감소했다. 몬트리올 의정서에 따른 조치로 인해 염화불화탄소(CFCs)와 같은 통제 및 통제되지 않는 오존층 파괴 물질(ODS)에서 성층권으로 유입되는 염소의 총량은 1993년 최고치인 3천660ppt(1조 분의 1)에서 2020년 3천240ppt로 11.5% 감소했다. 남극의 총 오존 수치는 2065년경에는 1980년의 수치로 돌아갈 것으로 예상된다. 2045년경에는 북극의 총 봄철 오존 수치가 1980년의 수치로 돌아올 것으로 예상된다.
The ozone hole was smaller in the 2011〜2020 period than during the two previous decades. On average, over the 2011〜2020 period, the annual maximum mass deficit was lower than during the previous two decades. Due to the actions taken under the Montreal Protocol, the total amount of chlorine entering the stratosphere from controlled and uncontrolled Ozone Depleting Substances(ODSs) such as Chlorofluocarbons(CFCs) declined by 11.5% from its peak value of 3660 ppt in 1993, to 3240 ppt in 2020. Total ozone values in the Antarctic are projected to return to 1980 values by around 2065. Total springtime ozone is expected to return to 1980 values in the Arctic by approximately 2045.
기후변화, SDGs 진전에도 영향 미쳐
지속가능한 발전목표(SDGs)를 달성하고 파리 협정의 목표를 달성하기 위해서는 하나의 발전이 다른 하나의 발전으로 이어질 수 있는 시너지 효과가 필요하다. 이 보고서는 극한 현상과 발전 사이의 구체적인 관계를 처음으로 보여준다. 선별된 사례 연구들은 지난 10년간 극한 현상들이 어떻게 지속가능한 발전목표를 향한 진전을 방해했는 지를 유엔 기관 및 통계청과 학제 간 협력을 통해 보여준다.
10년에 걸친 극한 현상들은 특히 식량 안보와 인간의 이동에 큰 영향을 미쳤다. 기상 및 기후 관련 현상들은 지난 10년간 기록된 모든 재난으로 인한 피난의 약 94%를 차지했으며, 기아, 식량 불안정, 영양실조를 종식시키기 위해 진행 중인 전 세계적 노력을 퇴보시켰다.
많은 극한 현상에서 큰 규모의 현상이 일어날 가능성은 인위적인 기후변화로 인해 크게 바뀌었다. 사실상 모든 귀인 연구(Attribution Study)에서 극단적인 더위로 인한 현상이 일어날 가능성이 상당히 증가한 것으로 나타났다. 폭염이 사상자 수를 가장 많이 낸 반면, 열대성 저기압은 경제적 피해를 가장 많이 냈다.
In order to achieve the SDGs and meet the targets of the Paris Agreement, there is need for synergistic action, whereby advancements in one can lead to improvements in the other. For the very first time, this report demonstrates concrete connections between extreme events and development. Working in interdisciplinary collaboration with United Nations agencies and National Statistics Offices, select case studies demonstrate how extreme events across the decade have impeded progress toward the SDGs.
Extreme events across the decade had devastating impacts, particularly on food security and human mobility. Weather and climate-related events were responsible for nearly 94% of all disaster displacement recorded over the last decade, and played a role in the backward trend in the progress of global efforts to end hunger, food insecurity, and malnutrition.
For many extreme events, the likelihood of an event of that magnitude has been altered, often greatly, because of anthropogenic climate change. Virtually every attribution study found that the likelihood of an extreme heat event increased significantly. Heatwaves were responsible for the highest number of casualties, while tropical cyclones caused the most economic damage.
조기 경보 시스템 도입으로 사상자 수 감소
조기 경보 시스템 개선과 관련해 극한 현상으로 인한 사상자 수는 감소했지만 경제적 손실은 증가했다. 이러한 감소의 주요 원인은 예측의 개선과 더불어 재난 관리의 개선에 의해 주도된 조기 경보 시스템의 개선이다. 2011〜2020년에는 1950년 이후 처음으로 사망자가 1만 명 이상인 단일 현상이 단 한 건도 발생하지 않았다.
그러나, 극한 날씨와 기후 현상으로 인한 경제적 손실은 계속해서 증가하고 있다. 2005년 허리케인 카트리나(Hurricane Katrina)가 세계에서 경제적 피해를 가장 크게 입힌 기상 재해로 남아 있지만, 그 다음 순으로 경제적 피해를 많이 입힌 기상 재해는 모두 2011〜2020년에 발생한 허리케인으로, 미국에 가장 큰 영향을 미쳤다.
현상의 종류와 지리적 분포 측면에서 많은 사상자를 낸 현상과 큰 경제적 손실을 낸 현상 사이에는 대조를 보였다. 1천 명 이상의 사망자를 낸 것으로 알려진 13개의 현상 중 6개는 폭염이었고, 4개는 몬순(Monsoon) 홍수 및 홍수와 관련된 산사태였으며, 3개는 열대성 사이클론이었다. 100억 달러 이상의 경제적 손실을 입힌 27건의 현상 중 2022년에는 미국 내에서 16건, 동아시아에서 8건이 발생했으며, 이 중 13건이 열대성 사이클론, 홍수 8건, 산불 3건이었다.
![경제적 손실이 100억 달러를 넘는 것으로 알려진 27건의 현상 중 2022년에는 미국 내에서 16건, 동아시아에서 8건이 발생했으며, 이 중 13건은 열대성 사이클론, 홍수 8건, 산불 3건 등이었다. [사진출처 = 세계기상기구(WMO)]](https://cdn.waterjournal.co.kr/news/photo/202401/73004_45089_544.jpg)
The number of casualties from extreme events has declined, associated with improved early warning systems, but economic losses have increased. A major contributor to this decrease has been improved early warning systems, driven by improvements in forecasting, coupled with improved disaster management. The 2011〜2020 decade was the first since 1950 when there was not a single short-term event with 10,000 deaths or more.
However, economic losses from extreme weather and climate events have continued to increase. While Hurricane Katrina in 2005 remains the world’s most costly weather disaster, the next four most costly events were all hurricanes that occurred in the 2011-2020 decade, and whose greatest impacts were in the United States and/or its territories.
There was great contrast between events causing large numbers of casualties and those incurring great economic losses, both in terms of the type of event and their geographic distribution. Of the 13 known events resulting in more than 1000 deaths, six were heatwaves; four were monsoonal flooding or landslides associated with such flooding, and three were tropical cyclones. Of the 27 events with known economic losses exceeding 10 billion US dollars(USD), in 2022, 16 occurred within the United States and eight in East Asia; 13 of the 27 events were tropical cyclones, eight floods and three wildfires.
[출처 = 세계기상기구(WMO)(https://wmo.int/news/media-centre/rate-and-impact-of-climate-change-surges-dramatically-2011-2020) / 12월 5일자 보도자료]
[『워터저널』 2024년 1월호에 게재]